The dynamometer analysis can understand the real-time dynamics of the well and whether the pumping unit is reasonable [1]. At the same time, the indicator diagram is one of the important basis for the fault diagnosis of the pumping unit. Therefore, the measurement of the dynamometer is very important for the improvement of the working efficiency and automation level of the entire pumping system.
At present, the method of measuring the displacement and stroke using the dynamometer at the oil production site is mainly based on the pull wire type. However, the method of measuring the displacement and stroke by the pull wire type has the disadvantages of heavy weight, high breakage rate and serious local wear, which causes the on-site operation. A lot of inconvenience. To this end, in response to the urgent need of the oil production site, the design scheme of the miniaturized and cordless indicator diagram tester is proposed to completely avoid the defects inherent in the cable type.
Hardware circuit design
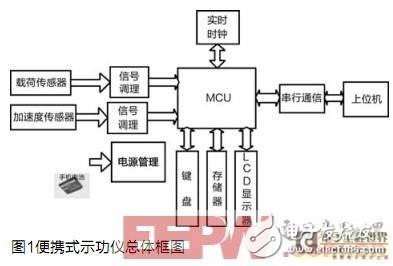
The hardware block diagram of the dynamometer tester based on the acceleration sensor is shown in Figure 1. It is mainly divided into four parts: power management system, load signal conditioning circuit, acceleration signal conditioning circuit, main control and auxiliary equipment circuit. Among them, the acceleration sensor is responsible for collecting the acceleration signal of the oil rod up and down movement, and obtaining the displacement and stroke through the integral algorithm, which is the design core of the power diagram tester hardware.
Acceleration signal conditioning circuit
The displacement and stroke of the dynamometer tester are obtained by double integration of acceleration. Taking into account the characteristics of the periodic movement of the oil rod, the periodic acceleration measurement is subtracted from the average value to make the boundary condition zero. The acceleration is integrated to obtain the velocity; the boundary condition is zero, and the stroke is integrated for the corrected velocity [2]. Since the original acceleration signal must be filtered accordingly, the double integral algorithm for removing the boundary is more complicated. Therefore, the system adopts the method of filtering integration of the single-chip program, and the scheme of the hardware integrator is abandoned to realize the integral algorithm. The circuit is shown in Figure 2. The display is composed of an acceleration sensor chip ADXL203, a suitably configured peripheral device, and TI's MSP430F1611 microcontroller. Among them, the COM pin is a common ground, DNC is a floating pin, Vs is a power supply pin, ST is a self-test pin (this pin is connected to a low level during normal use), and XOUT and YOUT are horizontal and vertical accelerations. Measurement signal output.
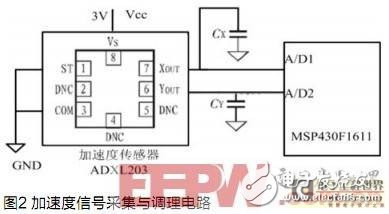
The ADXL203 is a high-precision, low-power iMEMS dual-axis accelerometer chip [3] with a signal-adjustable voltage output that measures both dynamic acceleration and static measurements such as gravitational acceleration. The ADXL203 typically has a measurement range of ±1.7g and withstands an ultimate acceleration of 3500g. The pull-down current is less than 700mA, and the output is an analog voltage signal proportional to the acceleration, and the sensitivity reaches 1000mV/g.
The ADXL203 accelerometer outputs a square wave signal whose amplitude is proportional to the measured acceleration. The sensor is mainly composed of a polysilicon mechanism using surface micromachining and a differential capacitor. Under the action of acceleration, the polysilicon structure will be offset, and the center plate of the differential capacitor is pulled to slide, so that the two capacitance values ​​are different. The center plate generates a voltage, the sensor outputs a square wave, and the amplitude of the output square wave is proportional to the measured acceleration. When the supply voltage changes, the sensitivity changes accordingly, affecting the measurement accuracy. For example: 5V voltage supply, output voltage proportional coefficient 1V / g; 3V voltage supply, output voltage proportional coefficient 0.56V / g. The system has two capacitors of 0.01mF and 10mF in parallel with the power supply end of ADXL203, which filters the low frequency and high frequency noise signals well, greatly reducing the influence of power supply ripple on the output voltage of the acceleration sensor.
The ADXL203 allows the output signal bandwidth to be designed by changing the size of the filter capacitor at the XOUT and YOUT pins as needed. According to the noise analysis of the actual pumping site, the filter capacitors at the XOUT and YOUT pins have been selected to be 0.01mF, 0.1mF and 10mF, among which 10mF filter capacitors have the least burr, the best effect, thus achieving the maximum hardware level of the signal. De-aliasing and denoising.
MSP430 microcontroller A / D acquisition and data processing
After the above acceleration level and vertical signal are conditioned, they must be input to the A/D of the MSP430 MCU for analog-to-digital conversion. The ADC12 module [4] in MSP430 can realize analog-to-digital conversion with 12-bit precision. The system uses the output voltage of the regulator chip 3V as the A/D reference power supply.
The vertical acceleration of the dynamometer tester changes greatly, and the horizontal acceleration changes little. Vertical acceleration signal range: 1~2V, horizontal acceleration signal range: 0.5~2.5V. Through the analysis of the above MSP430 A/D function characteristics, it is determined that it can fully meet the collection requirements of the dynamometer signal.
The dynamometer acceleration does not result in an accurate stroke after removing the boundary integral twice, often resulting in two very different strokes for the same well. Because the voltage signal of the acceleration amount is small, the proportional coefficient of acceleration and voltage caused by the 3V power supply system is very small (0.56V/g), and the acceleration and voltage signals collected by the MCU are seriously interfered. Therefore, the collected acceleration signal must be properly filtered and then double-integrated to obtain the stroke.
First, the data of the acceleration acquired in one cycle is stored in the RAM, and the singular value is filtered out by the acceleration data; then the 7-point smooth window filtering is performed on the acceleration amount to filter the noise signal to the maximum; finally, Applying the double integration of the period to the boundary to obtain the displacement value of each point, corresponding to the load amount of each point, draw a power diagram on the LCD screen, and store the well information and the indicator map information into the external EEPROM.
Composite filtering method of acceleration signal
The dynamometer uses the acceleration signal to perform the double integral algorithm to obtain the displacement and stroke. However, the acceleration signal causes slight distortion of the waveform due to the influence of power supply ripple and signal interference. After double integration, the cumulative error of the stroke increases. Aiming at the problems of displacement and stroke measurement of acceleration signals, this paper proposes an improved composite filtering method based on the analysis of morphological filtering and traditional smoothing filtering.
Morphological filtering
Morphological filtering [6] is a nonlinear digital filtering technique mainly used in the field of face recognition. According to the characteristics of the acceleration signal, the morphological filtering can effectively suppress the noise of the acceleration signal, and better maintain the geometric characteristics of the acceleration signal [5]. In this paper, the combination of corrosion and diffusion is used to achieve the effect of morphological filtering. The core algorithm is defined as:
Y={[(fΘg)⊕g](n)+[(f⊕g)Θg](n)}/2
Among them, [(fΘg)⊕g](n) represents the morphological opening operation, [(f⊕g)Θg](n) represents the morphological closing operation, and g represents the structural element. This paper selects {0,7.0711,10,7.0711,0 }.
Through the oil pumping field test, the displacement and stroke measurement results of the beam pumping unit are ideal, and the acceleration signal waveform is shown in Fig. 3.
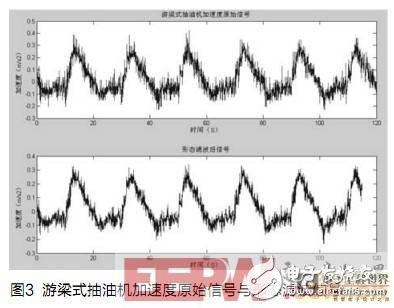
However, the structural element g is only designed for the beam pumping unit, and has no compatibility with the belt pumping unit, and the field test results have large errors. Since the performance of morphological filtering is closely related to structural elements, when the a priori waveform of the signal cannot be determined, the adaptive method should be used to estimate the optimal size of the structural elements. Obviously, it is not practical to use the MSP430 microcontroller for adaptive algorithms.
Improved sliding filter
The conventional sliding smoothing filter only samples once, and averages this sampling value together with several sampling values ​​in the past. If N sampling values ​​are averaged, a temporary storage area of ​​N data must be opened in the RAM.
Because the punching times (the number of round trips of the pumping unit up and down in 1 minute) are calculated by judging the two highest points of acceleration (the number of points between the two highest points multiplied by the sampling period of 50ms to obtain the pumping unit operating cycle, the punching times =60/cycle). Using the traditional sliding filtering method, the highest point of misjudgment rate is high, and it is difficult to obtain an accurate cycle. This paper adopts an improved sliding filtering method, which solves the above problems well.
The MSP430F1611 (10K RAM) is used to define an array of 1800-size floating-point numbers for storing the acceleration original signal of 90s. After 3 sliding smoothing filters, the formula is as follows:
3-point sliding block: XK=(XK-1+XK+XK+1)/3 (1≤K≤N-1)
7-point sliding block: XK+(XK-3+XK-2+XK-1+XK+XK+1+XK+2+XK+3)/7 (3≤K≤N-3)
Where: XK represents the acceleration data acquired at the Kth time; N represents the number of acquired data; K represents the serial number of the current acceleration signal.
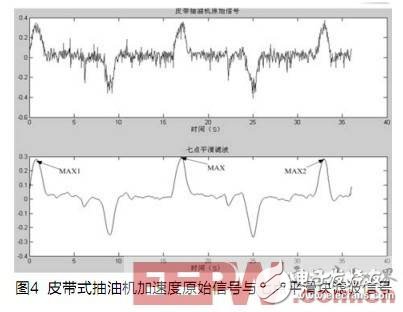
Find the maximum value MAX after processing all the acceleration signals collected by 90s through the 3-point slider or 7-point slider. Then find the nearest maximum values ​​MAX1 and MAX2 (MAX-MAX10.01V, MAX-MAX20.01V) before and after MAX. Calculate the period and the number of impulses at the 50ms sampling interval:
![]()
Where: T represents the pumping unit up and down cycle; nMAX1 represents the acquisition number of the MAX1 point; nMAX2 represents the acquisition number of the MAX2 point.
This paper compares the waveforms of the 3-point sliding block and the 7-point sliding block, and compares the calculated displacement and stroke. It is found that the 7-point sliding block can reflect the true acceleration signal, and the stroke measurement of the same well is reproducible. 4 is shown.
Acceleration double integral algorithm
The dynamometer tester uses the acceleration signal to indirectly obtain displacement and stroke information. After obtaining the measured value of the acceleration, it is necessary to solve two problems to calculate the relative displacement of the sucker rod motion: the zero point correction of the acceleration and the determination of the boundary condition when the speed is obtained by the integral. Since it is only necessary to obtain the relative displacement of the sucker rod motion, the boundary condition can be set to zero when the displacement is obtained by the speed integral.
After a theoretical comprehensive derivation, the algorithm for obtaining displacement or stroke from acceleration can be expressed as:
(1) Subtracting the measured value of the acceleration in one cycle from the average value, making the boundary condition zero, and obtaining the speed of the corrected acceleration integral (using numerical integration in MSP430);
(2) Subtract the obtained speed from its average value, make the boundary condition zero, and integrate the corrected speed (using the numerical integration in MSP430) to obtain the relative displacement or stroke.
Field test data analysis
The deviation of the actual position of the accelerometer ADXL203 on the board can directly affect the size of its output signal. This design places the ADXL203 horizontally on the board. In order to verify the accuracy of the placement of the ADXL203, it was tested 5 times in both horizontal and vertical modes. The test results show that the error of both X and Y axes is less than 0.5% regardless of whether it is placed horizontally or vertically. This shows that during the design, welding and installation process, the position of the ADXL203 is very accurate, achieving the specific accuracy requirements of the double boundary integral algorithm.
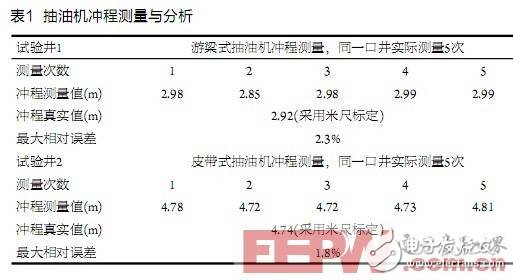
For the different types of pumping well types of beam pumping unit and belt pumping unit, several on-site measurements and data analysis have been carried out successively. The data and analysis using stroke measurement as an example are shown in Table 1. The beam pumping unit converts the rotary motion into the sucker rod up and down movement. The motion law of reciprocating once is close to the sine wave change, and the stroke is shorter. The belt pumping unit directly drives the sucker rod to move up and down, and the motion law is close to the rectangular wave. Change, and the stroke is longer.
Conclusion
The field test results show that the displacement or stroke measurement technique studied in this paper is applicable to different pumping well types with strokes from 2.1m to 5m and strokes from 0.8 to 5, and has higher measurement accuracy; "0.8 rushed heavy oil well pumping unit, the measurement error is too large.
Screen Protector Cutting Machine
Tpu Hydrogel Cutting Plotter,Inteligent Screen Protector Cutter,Mobile Phone Cut Plotter,Screen Protector Cutter
Shenzhen TUOLI Electronic Technology Co., Ltd. , https://www.szhydrogelprotector.com