In the previous section, we introduced two important measurement parameters for measuring PA-gain and output power. Embrace the 5G dividend. Is the RF front-end test done? In this section, we will introduce another important parameter for measuring low noise amplifiers (LNA)-noise figure. Although there are many ways to measure noise figure, the two most commonly used methods are cold source method (also called Is the gain method) and the Y factor method.
Basic knowledge of noise figure at a glance
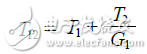
There are many ways to quantify the noise figure and noise factor. One of the earliest definitions was put forward by Harold Friis in the 1940s. In the definition of Friis, the noise factor (the linear equivalent of the noise figure) is the reduction in the signal ratio (SNR) when a specific signal passes through a specific component. Both the noise factor and the noise figure are unitless physical quantities, the noise factor is expressed in a linear manner, and the noise figure is expressed in a logarithmic form.

As shown in Equation 1, if the SNR of the signal at the input of the LNA is 100dB and the noise figure is 5dB, then the SNR of the output is 100-5dB = 95dB. As shown in Figure 10, a "black box" component with a noise figure of XdB will reduce the SNR by XdB
Inherent noise power other than thermal noise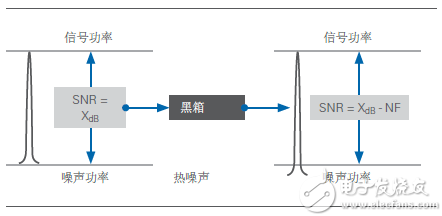
Another definition of noise figure is the additional noise power introduced by specific active devices and passive devices at room temperature thermal noise power of -174dBm/Hz, in dB. This definition is consistent with the IEEE's definition of noise factor, which has been widely accepted and is represented by Equation 2.
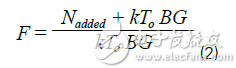
Where k represents the Eartzmann constant
T0 means normal temperature
B means bandwidth
G represents the gain of the DUT
Equation 2. Formal definition of noise factor
In Equation 2, kTo is simplified to thermal noise at room temperature, which is -174dBm/Hz. Therefore, the noise factor is equal to the signal power plus the noise power introduced by the component.
For example, when the antenna is connected to the LNA, the noise power at the input of the LNA is -174dBm/Hz. At the output of the LNA, the noise power is equal to -174dBm/Hz plus the noise figure of the LNA. In this case, a noise figure of 5dB will produce an output noise power of -169dBm/Hz. Please note that in this case, since the noise figure is expressed in a logarithmic manner, the noise power is directly equal to 5dB plus -174 dBm/Hz.
Noise unit conversion
Before introducing the noise figure measurement in detail, we must first clarify the definitions of some commonly used units and terms in noise measurement. The most common measurement parameters include noise figure, noise factor, and noise temperature.
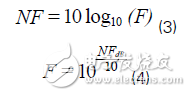
The noise figure (NF) is equal to the noise power of the device plus the thermal noise power, in dB, the noise factor (F) is a linear expression of the noise power introduced by the device on top of the thermal noise. Use formulas 3 and 4 to convert NF to F, and vice versa.
A related expression for noise power is noise temperature. Since the noise power is proportional to the Kelvin temperature of the device, the noise temperature (Te) refers to the equivalent temperature when the device generates a certain amount of noise power. It should be noted that the equivalent noise temperature of the device is only a theoretical value, which is only used to represent the theoretical temperature when the passive device generates a specific noise power level. Equations 5 and 6 describe the relationship between noise temperature and noise figure.
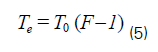
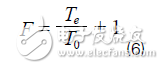
In equations 5 and 6, T0 usually refers to room temperature or 290K. According to these two equations, a device with a noise factor of 4 or a noise figure of 6.02dB has an equivalent temperature of 290K (4-1) = 870K. Based on this calculation result, for the device heated to 870K, its inherent thermal noise is 6.02dB higher than the thermal noise of the device at room temperature of 290K. Therefore, the equivalent temperature of 870 dB is equivalent to a noise factor of 4 or a noise figure of 6.02 dB.
The Friis formula used to calculate the noise factor of a cascaded RF system is very important for measuring the noise factor. Because when measuring the noise figure of the device, all measurement parameters must be taken into account, including the noise of the equipment under test and the noise of the instrument itself. The Friis formula is applicable to the cascaded RF system shown in Figure 11.
Cascade RF system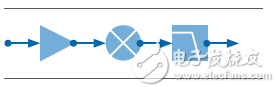
Using the Friis formula shown in Equation 7, the noise figure (F) of the system can be calculated.
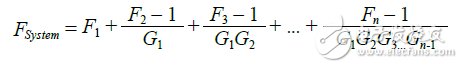
It should be noted that the Friis formula requires both noise and gain to be expressed in linear rather than logarithmic form. In addition, it should be noted that if the first component of the system has a higher gain, such as LNA, the noise system of the system can usually ignore the other terms of Equation 7, and only the first two items need to be considered. Therefore, Equation 7 can be simplified as Equation 8.
Similarly, we can calculate the noise temperature of the cascade by using a similar equation. By replacing the noise factor in the equation with the noise temperature, it can be concluded that the noise temperature of the first component in the cascade system is equal to the system noise figure minus the noise of the second component, as shown in Equation 9.
Noise figure measurement
Although there are many methods for measuring noise figure, the two most commonly used methods are the cold source method (also known as the gain method) and the Y-factor method. The basic principle of the gain method is to receive the input of the test equipment, and then use a signal analyzer to measure the output noise of the DUT, as shown in Figure 12. In this case, the output noise power is the result of amplifying the inherent noise of the DUT by the gain of the DUT.
Cold source noise figure measurement method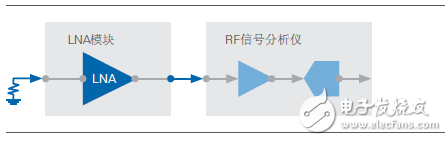
The cold source method is usually the most effective for high-gain LNAs, because the signal analyzer can measure the noise power more accurately for signals that are significantly higher than the inherent noise floor of the noise floor. One of the disadvantages of the cold source method is that it is susceptible to the uncertainty of the voltage standing wave ratio (VSWR).
In addition, general methods to improve VSWR, such as using an external attenuator, will reduce the instrument's ability to measure low-power signals. Therefore, if the VSWR can be compensated, the measurement results of the cold source measurement technology are more accurate. In fact, assuming that the background noise is low enough, you can occasionally use a network analyzer to measure the noise figure, because the network analyzer can reduce the uncertainty caused by VSWR.
Y-factor method based on calibrated noise source
The second method of noise figure measurement may be more common, the Y-factor method. This method introduces a calibrated noise source into the LNA or PA, and measures the noise power when the noise source is turned on and off. If the DUT and signal analyzer are used as part of a two-stage cascaded RF system, the Y-factor method is simpler, as shown in Figure 13.
Y-factor noise figure measurement method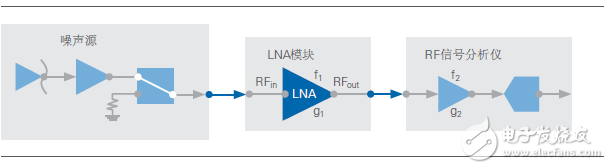
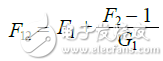
After connecting the noise source (usually an LNA or demodulator) to the input of the DUT, the test system can be modeled as a two-stage system. In this case, the noise figure of the system includes the noise figure of the first component LNA and the noise contribution of the RF signal analyzer. The Y-factor method aims to first measure the noise figure of the DUT (F1) by solving the noise figure (F12) of the system and the gain of the DUT (G1). Therefore, the process of using the Y-factor method to measure the noise figure of RF components involves the following two steps:
1. Measure the noise figure of the signal analyzer.
2. Measure the noise figure of the system after connecting to the DUT.
An important component of the Y-factor test system is the calibration noise source. Because the calibration noise source can provide a noise-like signal to the device under test (DUT) at a relatively low power level, it is very useful when measuring the noise figure.
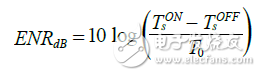
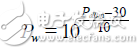
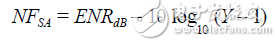
The noise source has two settings, on and off, and its characteristic parameter is the redundant noise ratio (ENR). ENR can be represented by Equation 10, where TsON and TsOFF represent the equivalent temperature and noise power for each setting. In actual measurement, it can usually be assumed that TsOFF = T0 = 290K. The ENR of the noise source is usually printed directly on the device or marked in the specification file. The typical ENR value ranges from 5 dB to 30 dB, depending on the actual application.
Step 1: Analyze the noise figure characteristics of the signal analyzer
The first step in measuring the noise figure using the Y-factor method is to measure the noise figure of the signal analyzer without connecting the DUT. Please note that the noise source generally requires 28 VDC power supplied by the 28 VDC port of the RF signal analyzer, as shown in Figure 14.
Calibration steps of the Y-factor method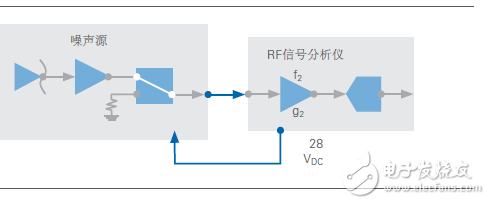
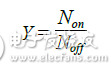
In the system shown in Figure 14, the Y factor is the ratio of two noise power levels. One noise power is measured when the noise source is turned on, and the other is measured when the noise source is turned off. Therefore, the Y factor measurement consists of two power measurements, Non and Noff. Please note that the ratio of Non and Noff must be expressed in a linear manner, and the unit of noise power is watts. The calculation formula is shown in Equation 11.
Non and Noff can be measured using the channel power measurement function of the RF signal analyzer. Since the accuracy of the noise figure measurement using an RF signal analyzer depends on the noise figure of the instrument itself, it is necessary to minimize the noise figure of the instrument through the following steps:
1. Turn on the instrument's preamplifier (if any).
2. Set the reference level as low as possible, usually less than -50dBm.
3. Manually set the attenuation of the instrument to 0dB.
Please note that for the VSWR of a high-gain DUT, the benefit of adjusting the attenuation of the instrument to greater than 0dB may be greater than the noise floor that can be reduced by zero attenuation. Although the Y-factor method can theoretically reduce the uncertainty caused by VSWR, because the signal analyzer may not match during the calibration step and the measurement step, a small amount of error caused by VSWR still exists.
After completing the above settings, you can use the in-band power measurement method to measure the noise power of the RF signal analyzer. Compared with using only markers to measure the noise floor, in-band power measurement provides a more accurate noise power measurement method. If the power is measured in dBm, just replace the equation 12dBm with W.
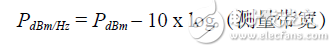
Because the in-band power measurement method measures the noise power of a large number of frequency bands, the bandwidth of the measurement will significantly affect the power measurement results. For example, -90dBm in a 1MHz bandwidth is equal to -100dBm in a 100kHz bandwidth. Therefore, the noise power is usually expressed in dBm/Hz, as shown in Equation 13.
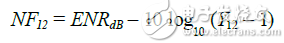
It should be noted that although the noise power expressed in dBm/Hz can provide information on the noise floor of the signal analyzer, the measurement bandwidth usually does not affect the Y factor ratio unless the measurement bandwidth is wider than the bandwidth of the noise signal itself. Assuming that the same measurement bandwidth is used to measure Non and Noff, the units of the two bandwidths cancel each other out. The general principle is to make the measurement bandwidth narrower than the output bandwidth of the noise source, equal to or narrower than the bandwidth of the DUT signal to be amplified. After determining the Y factor according to the above power measurement method, the noise figure is only a function of ENR and Y factor, as shown in Equation 14.
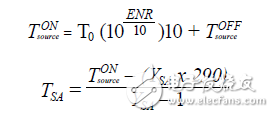
Or you can use the noise temperature to express the noise, and then solve the noise figure and noise factor. Assuming that the noise source is turned off
T0= 290K (normal temperature), then the noise temperature of the noise source in the on-state is a function of ENR. Using equations 15 and 16 can first solve for the noise temperature of the noise source based on the ENR, and then use this value and the measured Y factor to calculate the noise temperature of the signal analyzer.
Step 2: Insert DUT
Connect the noise source directly to the signal analyzer, you can solve the noise figure/noise factor/noise temperature of the RF signal analyzer, and then you can measure the system noise figure after connecting to the DUT. Therefore, the output terminal of the noise source needs to be connected to the input terminal of the DUT, as shown in Figure 15.
Steps to measure Y factor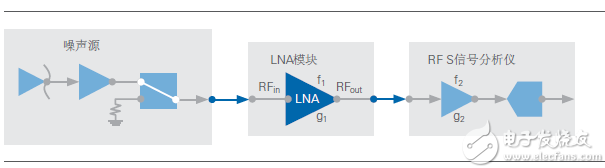
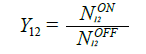
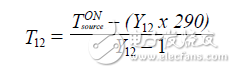
After connecting the DUT between the noise source and the signal analyzer, the terms F12, G12, and T12 respectively represent the noise figure, gain, and noise temperature of the entire system. Similar to the calibration procedure, the Y factor of the entire system needs to be calculated next. This step measures the Y factor of the system or cascade, and then finally calculates Y12.
You can also use Equation 18 or 19 to calculate the noise figure or noise temperature of the system, respectively.
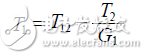
After determining the noise figure (NF12) or noise temperature (T12) of the entire system, the Friis formula can be used to calculate the noise figure of the DUT.
Step 3: Calculate the noise figure
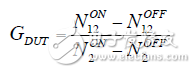
After measuring the noise figure or noise factor of the signal analyzer and the measurement system after connecting to the DUT, the noise figure of the DUT can almost be solved. But before that, the gain of the DUT needs to be calculated, as shown in Equation 20.
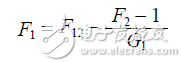
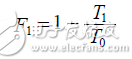
After determining the system noise figure (F12) and DUT gain (G1), the Friis formula can be used to solve the DUT noise figure, as shown in Equation 21. It should be noted that the Friis formula expresses the noise figure in a linear manner, so any unit of gain or noise figure must be converted to a linear expression.
Or if all the measurement results are expressed in terms of noise temperature, Equation 22 can be used to solve for the noise temperature of the DUT.
Again, the gain must be expressed in a linear manner. After calculating the equivalent noise temperature of the DUT (T1), it can be converted into a noise figure using Equation 23.
The Y factor method used to measure noise figure is a more accurate LNA or even RF noise figure measurement method. Although the understanding of noise figure, noise factor and noise temperature requires a certain theoretical basis, as long as you master the basic knowledge, you can accurately measure the noise figure.
Desktop style 12v and 24v series can be used in many different electronics. EMC, LVD, FCC, RoHS are available in our company. OEM and ODM are available, samples are free for testing, all our products have 2 years warranty.
Our products built with input/output overvoltage protection, input/output overcurrent protection, over temperature protection, over power protection and short circuit protection. You can send more details of this product, so that we can offer best service to you!
Led Adapter, Lcd Adapter,Speaker Power Adapter,Lcd Power Supply
Shenzhen Waweis Technology Co., Ltd. , https://www.laptopsasdapter.com