With the rapid development of science and technology, the new lighting technology is becoming more and more perfect. Special lamps such as laser lights, city lights, remote searchlights, and aerial roses have emerged as the times require, and have been applied in urban lighting. They have the common characteristics of long range, high luminous intensity and strong visual impact. They are often placed in the buildings, squares, restaurants, landmarks of Jingshan, parks and stadiums. They are one of the most luminous lamps in the city at night. . The light emitted by these lamps not only has a serious impact on the brightness of the city sky, but also has a very strong interference to the birds in the sky, the residents in the city, etc. [5-6]. Therefore, in the current low-carbon lighting has received much attention, how to scientifically and reasonably carry out the arrangement and use of searchlights is of great significance. Based on the orthogonal test method, the artificial sky model is used to investigate the angle of exit of the searchlight. The experimental analysis of the influence of the brightness of the light source and the cross-sectional area of ​​the outgoing beam on the brightness of the zenith is analyzed, and the influence of the setting factors of the luminaire on the brightness of the sky is analyzed.
1 Experiment of the influence of strong light spotlights on the night sky based on orthogonal design
1. 1 Characteristics of urban glare spotlights
Searchlights are a type of glare spotlight that has been widely used to attract attention to important objects, to mark orientation, to excite responses to concerts and stage programs, and to create special lighting effects for moving pictures and television production. The long illumination distance and concentrated illumination range are its unique characteristics.
Searchlights designed using the optical properties of mirrors are widely used in military, transportation, urban lighting and other fields. According to the use of searchlights, there are: high-altitude searchlights, glare searchlights, powerful searchlights and emergency searchlights. High-altitude searchlights are mainly used for urban lighting.
1. 2 Test methods
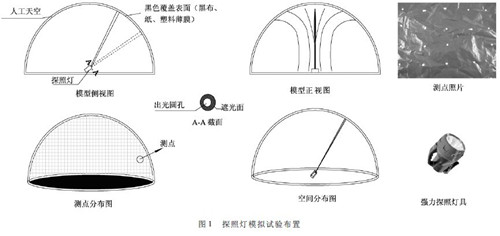
Due to the variety of stray light in the city, it is difficult to analyze the influence of the setting and performance of the searchlight on the sky. Therefore, this study uses an artificial sky with a diameter of 3m to simulate the illumination of the searchlight to the sky. See the test arrangement and test point distribution. figure 1. The instrument includes: two powerful searchlights (10W and 15W respectively, due to limited experimental space, for easy comparison, the light source high dimming range is controlled at 5,000 ~ 15000cd / m2, dimming from strong and weak files, effective range of 300 ~ 500 meters ), black cover film, fixed bracket, protractor, etc. The purpose of the black cover film is to reduce the internal diffuse reflection and then simulate the night sky. The measuring instruments are mainly: BM-7 color brightness meter and illuminance meter. By changing the parameters such as the exit angle, the cross-sectional area of ​​the beam, and the brightness of the light source, the brightness distribution of the night sky and the main influencing factors are revealed. The exit angle refers to the angle between the horizons of the lamps; the cross-sectional area of ​​the beam refers to the area of ​​the light exit of the lamp; the brightness of the light source refers to the output brightness of the light source. The test points are arranged according to the grid method, and each grid has a side length of 5 cm. The orthogonal experimental design method is an important mathematical method to solve the multi-factor comparison test problem. It mainly uses orthogonal tables for overall design, comprehensive comparison and statistical analysis [9-11]. The experimental design shows that there are many factors affecting the night sky's brightening of the searchlight. The orthogonal analysis method is used to comprehensively process the test results by statistical analysis, and the optimal factors and levels are selected.
1. 3 Determination of the factors affecting the sky and the level
The orthogonal test first determines the influencing factors and the level values ​​of each factor. There are two main factors affecting the skylighting of the searchlight. One is the installation form of the searchlight, and the other is the performance parameter of the searchlight. The exit angle of the searchlight, the cross-sectional area of ​​the exit beam (area of ​​the light exit), and the brightness of the light source are the main factors that affect the sky. Therefore, this chapter determines the law of the arrangement and performance of the searchlights on the skylighting by orthogonal test.
Factors refer to different reasons that directly affect the test results and need to be investigated. This test selects the three factors of the exit angle (indicated by A), the brightness of the light source (indicated by B), and the sum of the cross-sectional areas of the outgoing beams (indicated by C). The test indicators for the test are the zenith brightness and horizontal illumination of the simulated night sky.
1. 3. 1 Determination of the level of change of influencing factors
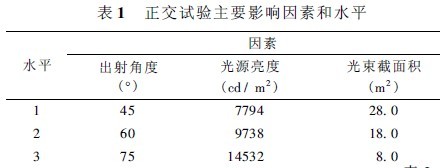
The test is a three-factor three-level test, (1) the exit angle, denoted by A. The three levels of change are 40°, 60°, and 80°, respectively. (2) The brightness of the light source, denoted by B, the three levels of change are 15W weak light, 10W strong light and 15W strong light, and the brightness is 7794cd / m2, 9738 cd / m2, 14532 cd / m2. (3) The cross-sectional area of ​​the beam, denoted by C, with three levels of change of 28 cm2, 18 cm2, and 10 cm2, respectively.
In order to eliminate the interference of systematic errors and human factors, when determining the horizontal number of each factor, the random number method is used to determine the horizontal number of each factor.
The above influencing factors and levels are summarized in Table 1. The ultimate goal of this test is to analyze the test results and to find out the main factors affecting the skylighting of the searchlight according to the corresponding indicators.
2 SPSS for orthogonal test design and analysis
2. 1 Arrange the orthogonal test design
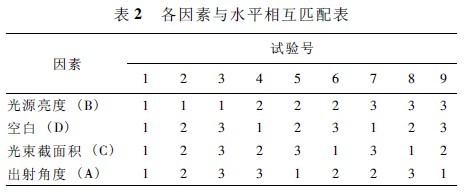
This experiment uses SPSS for orthogonal experimental design data processing, which can free this research from the traditional cumbersome and complicated data processing work. According to the SPSS data programming, 9 combinations (that is, 9 trials) are generated, the combination is sorted, the random lottery method is adopted to determine the ordering of the factors, and the head design and the arrangement test are performed according to the sorting. See Table 2 for the matching of factors and levels.
2. 2 Test design and results
The head design and arrangement test were performed according to the orthogonal table 2. The test methods and results are shown in Table 3. The test is a three-factor three-level test, and the orthogonal table L9(34) meets the test requirements. It can be seen from Table 2:
Table 3 experimental results
(1) Number of factors + interaction to be considered + blank item < number of orthogonal table columns;
(2) Number of levels of factors = number of orthogonal table levels;
(3) In each row and column, 1, 2, and 3 appear exactly one each.
This scheme can achieve the test purpose only by manufacturing and testing 9 times on the basis of ensuring uniform matching between various factors and levels. It takes 33 times to use a full test. These 9 tests can represent the best results of 33 tests, and can greatly reduce the number of tests, test time and cost. The importance of orthogonal design in multi-factor and multi-level experiments can be seen. Generally speaking, each factor takes three levels to see its changing pattern. The blank factor can be used to calculate and analyze the test error.
2. 3 SPSS output orthogonal test results and analysis
The physical and chemical index measurement results were input into the SPSS system for analysis and the output results were evaluated. The SPSS software can process various designs through univariate analysis of variance, including random block design and factorial design. There are 2 tables for each response in the output, namely Tests of Between-Subjects Effects, Estimated Marginal Means, and Profile Plots.